This month's CoStar Commercial Repeat Sale Indices (CCRSI) provides the market's first look at commercial real estate pricing trends through November 2016. Based on 1,120 repeat sale pairs in November 2016 and more than 170,000 repeat sales since 1996, the CCRSI offers the broadest measure of commercial real estate repeat sales activity.
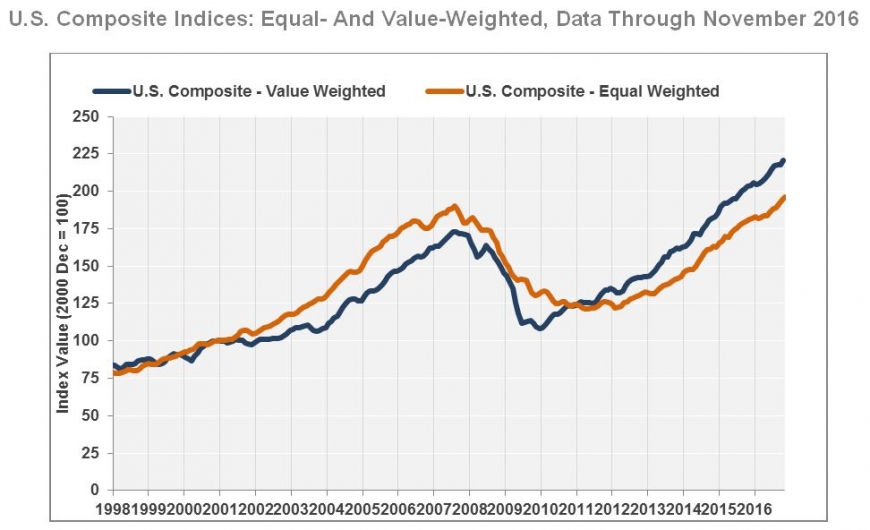
U.S. Composite Indices: Equal- And Value-Weighted, Data Through November 2016
U.S. Equal-Weighted Indices By Market Segment, Data Through November 2016
U.S. Pair Count, Data Through November 2016 U.S. Pair Volume, Data Through November 2016
U.S. Distress Sale Pairs Percentage, Data Through November 2016
Market Fundamentals, Data Through December 2016
CCRSI National Results Highlights
- PRICE INDICES ADVANCE IN NOVEMBER AS COMMERCIAL PROPERTY SALES POST STEADY GAINS. Both of CCRSI's two major composite price indices advanced by more than 1% in the month of November, an acceleration in the pace of growth from the monthly average growth rate of 0.7% from January 2016 through October 2016. The equal-weighted U.S. Composite Index rose 1.1% in November 2016 and is now 3.2% above its prerecession peak. Meanwhile the value-weighted U.S. Composite Index advanced 1.3% in November 2016, placing it nearly 28% above its prerecession high.
- STRONG ANNUAL SPACE ABSORPTION ACROSS THREE MAJOR CRE PROPERTY TYPES CONTRIBUTING TO PRICE GAINS. Demonstrating the overall demand for commercial property space, net absorption across the three major property types—office, retail and industrial—is projected to total nearly 680 million square feet for the 12-month period ending in December 2016, a 1.5% increase from the same period ending in December 2015. Demand from tenants leasing space has supported the extension of the pricing recovery. The general commercial segment, which reflects the performance of smaller properties, had the strongest rate of growth in absorption over the 12-month period ending in December 2016, with total net absorption projected to grow 22.1% in the 12-month period ending in December 2016. Meanwhile, net absorption in the investment-grade segment is expected to decrease 7.6% in the same period.
- TRANSACTION VOLUME ON PACE WITH RECORD LEVEL IN 2015. The CCRSI composite pair volume trailed last year's pace through much of 2016, likely reflecting broader financial market volatility from earlier in the year. However, sales activity picked up in November 2016, resulting in composite sale volume of $113.3 billion year-to-date through November 2016, an increase of 0.8% compared to the same period one year earlier.
Monthly CCRSI Results, Data Through November 2016
|
1 Month Earlier |
1 Quarter Earlier |
1 Year Earlier |
Trough to Current |
|
|
Value-Weighted U.S. Composite Index |
1.3% |
1.8% |
8.8% |
103.9%1 |
|
Equal-Weighted U.S. Composite Index |
1.1% |
3.8% |
8.1% |
61.0%2 |
|
U.S. Investment-Grade Index |
0.8% |
3.6% |
1.8% |
66.3%3 |
|
U.S. General Commercial Index |
1.1% |
3.9% |
9.2% |
60.9%4 |
|
1 Trough Date: January 2010 2 Trough Date: March 2011 3 Trough Date: March 2010 4 Trough Date: March 2011 |
||||
Market Fundamentals Data Through December 2016
|
Annual Net Absorption (in millions of SF) |
||||||||
|
2013Q4 |
2014Q4 |
2015Q4 |
2016Q4 |
|||||
|
Aggregate |
432.7 |
599.6 |
669.4 |
679.2 |
||||
|
Investment Grade |
298.6 |
396.7 |
464.5 |
429.0 |
||||
|
General Commercial |
134.1 |
202.9 |
204.9 |
250.2 |
||||
Note: "Net Absorption" is the change in occupied space, calculated based on three types of properties: office, retail, and industrial.

